⤶ (back to add-in presentation)
Analyzes With 1 Variable
Univariate analyzes
- Descriptive statistics, box plot, histogram, capability analysis, quantiles
- ImR and EWMA control charts with the Western Electric decision rules
- Change Point Analysis (CPA): automatic detection of historical changes in the mean (explanations here)
- Statistical tests on: average, standard deviation, autocorrelation, and confidence intervals
Pareto Analysis
- Most frequent classes with cumulative curve - find the 80/20 items!
- Use weights to assess relative importance
Distribution Fitting
- For simulations: Exponential, Lognormal, Normal, Triangular, Uniform, Weibull, etc.
- Use weights to assess relative importance
- Sample from known parameters to get the shape and properties
Time Series Forecasting
- Time series diagnosis: stability of the mean, autocorrelation, detection of cycles
- Holt-Winters double exponential seasonal smoothing (also called triple exponential)
- Autoregressive PLS: robust autoregressive and seasonal models
⤶ (back to add-in presentation)
Analyzes With 2 Variables
Means comparison and ANOVA
- T-Test for two independent groups and for paired observations
- F-test for several groups with Boneferroni all pairs comparison
- Power and sample size calculations using non-central T and F distributions
Simple Regression
- Correlation and density ellipse
- Linear regression, with polynomial term and standard transforms, residual analysis
- Nonlinear regression: built-in power law, exponential, growth & logistic S-shape models
Contingency Analysis
- Mosaic Plot to analyze crossed frequencies (Marimekko chart)
- 2D Frequency table - find the 80/20 items!
- Use weights to assess relative importance
⤶ (back to add-in presentation)
Multivariate Analyzes
Multiple Linear Regression
- Multiple linear regression using least squares
- Selection of variables and creation of crossed and square model terms
- Residuals analysis and dynamic charts for data exploration
- Multivariate diagnoses: outliers detection, Cook's distance, multicolinearity assessment
Stability Analyzer
- Determine the different stable periods in the process historical data
- Identify which factors could explain the observed changes
- Obtain recommendations on which variables could be the most influential ones
- Rapidly eliminate the irrelevant variables out of >250 variables!
Data Preparation
- Smart cleaning of abnormal and outlier values
- Elimination of redundant or variables with no variability
- Creation of a compact table with only the remaining values
- Imputation of missing values using regression, local medians, and linear interpolation
Plan a MSA
- Design the experiment: specify testers and samples
- Prepare the design: add replicates and randomize trials
- Generate data collection sheet with multiple measurements for the same treatment
MSA Results
- Variance decomposition: unbalanced random effect ANOVA, handling of negative variances
- Results visualization: multi-vari plots, S control chart, interaction plot
- Measurement usefulness: increment diagnosis, comparison to total or historical variation
- Risk analysis: Monte-Carlo simulation to design acceptance limits and understand decision-making risk
⤶ (back to add-in presentation)
Other Specialized Platforms
Monte-Carlo Simulation
- Decision variables or assumptions: choice of statistical distributions, truncation limits
- Calculated responses: random white noise, specification limits, user-defined formulas
- Random sampling: pure random or Latin hypercube on probabilities
- Statistical reports: histograms, descriptive statistics, capability analysis, variable influence ranking
- No programming required!
Optimization Solver
- Solver for bounded, constrained, nonlinear, nonconvex, non-differentiable problems
- Black-box optimization with several continuous, discrete and ordering variables
- Implementation of the MADS algorithm (mesh adaptive direct searches, derivative-free)
- Other methods: simulated annealing, genetic algorithm, Nelder-Mead, Fletcher-Reeves
- Initial exploratory random search to seek for good starting points
- Robust default values for all algorithmic parameters
⤶ (back to add-in presentation)
Tools and Utilities
Additional Tools
- Workbook navigation: in-ribbon organize list of sheets
- Workbook explorer: list sheets grouped by analysis type
- Confidence interval calculator on: mean, standard deviation, proportion, capability, tolerance
- Date picker: visual selection of dates in calendar widget
- Print our email active sheet in one click
- Easy access to local help file, or download it
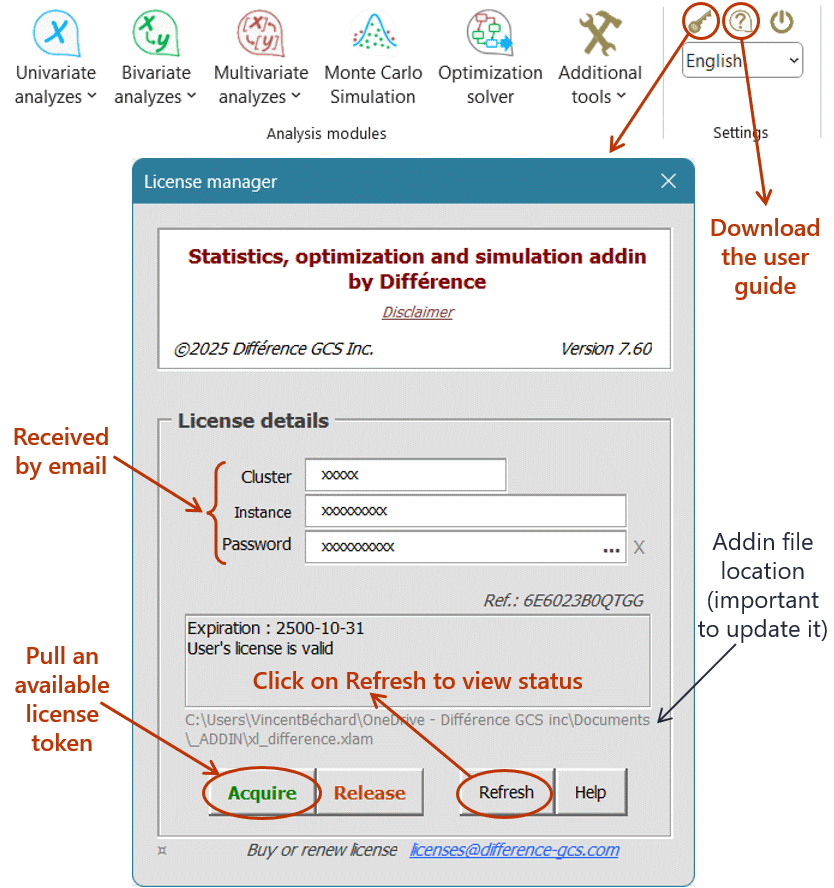
License Manager
- Flexible cloud-based licensing system!
- Acquire and release a license from a pool (need internet connection)
- Share licenses between devices and users
- Addin updates are automatically licensed (with annual subscription)
- Illustration of how to activate a license: