Différence's Excel Add-in for Statistical Analysis
Exclusive! Designed and programmed by Difference for the specific needs of the industry.
(version 8.15 updated on 2026-03-10)
Statistical Analyzes, Simulation and Change Point Analysis
In order to make basic statistical tools accessible and easy to use, we crafted an Excel-based tool showing only the essentials in an easy-to-interpret format. Some of its features are:
- Edit your data using the standard functionalities of Excel
- Get the descriptive statistics of one variable
- Build Individuals Control Chart
- Perform a capability analysis for Normal data
- Fit common statistical distributions
- Build and run Monte-Carlo simulation models
- Test one, two means or more means (t-test, ANOVA)
- Compare paired observations
- Perform linear regression and residual analysis

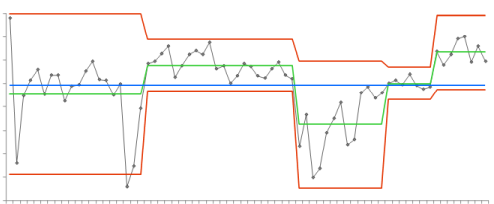
Change Point Analysis
In today’s environment, we are often buried under data ranging from sales and production figures to absenteeism and accident rates. Fundamental questions we try to answer when we look at a key performance indicator or historical data are: Did changes occur? When? What was their amplitude? Are we improving our performance? Are we sure?
The change point analysis, a versatile tool minimally affected by outliers, can analyze almost any kind of data. It identifies the moment a shift in mean was observed, the magnitude of the shift and the probability the shift is not a ‘real’ shift but just a pattern observed by chance. Read this short article to learn more about change point analysis.
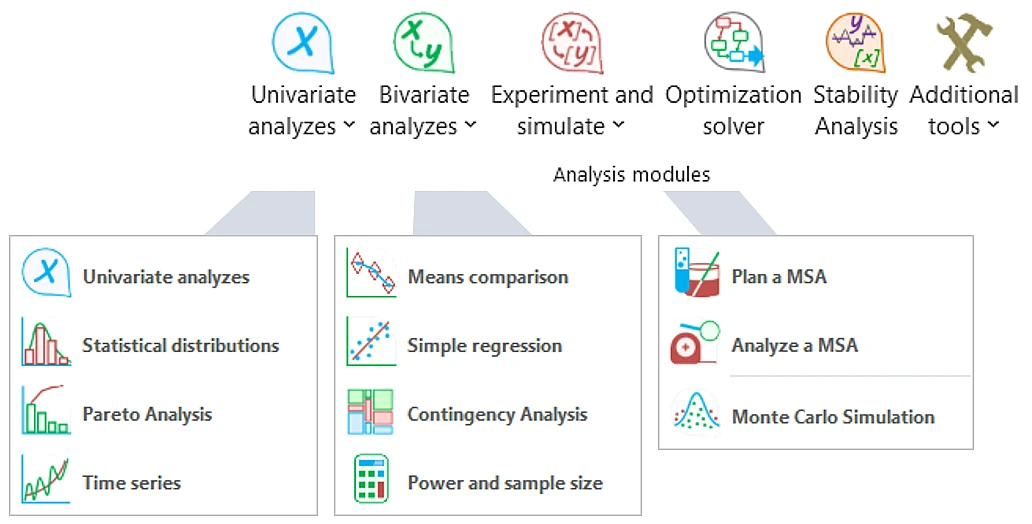
Add-in Features and Modules
Our add-in for statistical analysis is perfectly integrated into the Excel environment: it appears as an additional toolbar. The add-in is 100% written in VBA and does not require administrator privileges to be installed. It is also simple to manage a single or a group of cloud-based licenses! Transferring the license between computers and accounts only requires an internet connection.
Follow this link for a detailed presentation of all the features.
Downloading, Installing and Updating the Excel Add-in
The instructions to download, install and troubleshoot common issues are described below.
Requirements: Windows 7 or newer, Microsoft Excel 2013 or newer or Office 365, 32 or 64 bits platforms.
Integrating to Excel
Step 1: Make sure Excel is completely closed
Step 2: Download the latest version
Step 3: Save or overwrite the file in a permanent location (local hard drive; ex.: in My Documents folder)
Note: You might need to unblock the file from internet or to set trusted locations (see tutorial here)
Step 4: Double-click on the file "xl_difference.xlam" to open it, enable Excel macros
Step 5: That's it, the add-in is now automatically launching with Excel!
Obtaining a license
Step 1: Send a request by email to: contact@difference-gcs.com
Step 2: Open the License Manager (key icon) and enter the received: Cluster, Instance and Password
Step 3: Click on "Acquire"; if a license is available in the pool, you will obtain it
Refresh: You can query anytime the status of your license
Release: Return the license to the pool of available for acquisition
See here for illustrated instructions
Related files
In case you need to manually download the user manual file or the CPA helper workbook:
User guide (French)
User guide (English)
CPA.xlsm (to be saved in the xl_difference.xlam folder)